Datacopia
Create charts & graphs online instantly!
Monday, August 18, 2014
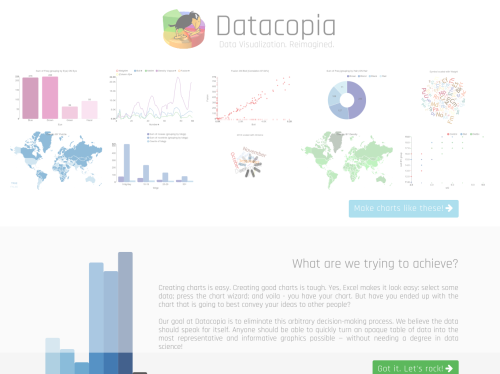
Creating charts is easy. Creating good charts is tough. Yes, Excel makes it look simple: select some data; press the chart wizard; and voila - you have your chart. But have you ended up with the chart that is going to best convey your ideas to other people? Our goal at Datacopia is to eliminate this arbitrary decision-making process. We believe the data should speak for itself. Anyone should be able to quickly turn an opaque table of data into the most representative and informative graphics possible — without needing a degree in data science! Datacopia examines and evaluates your data, then picks, ranks, and generates the most appropriate visualizations for you. And fast! This means you no longer need to decide (or know) up front how best to represent your data. Datacopia has been built from the ground up to take the pain and guesswork out of creating charts & graphs, so you spend less time manipulating spreadsheets, and more time understanding your data.
automatic data visualization startupscharts startupsgraphs startupsvisual data analysis startups